Code performance tuning in .NET
One of the things I’ve been busy with over the last two weeks has been to re-write the backend to PowerTime. Binary files are a nightmare to program, debug and maintain. With that in mind I’ve re-coded the backend to use SQLite through ADO.NET.
In due course, through the joys of ADO.NET, this will mean that TimeTag will be able to use any of a wide range of relational databases.
Unfortunately, and this probably won’t surprise too many programmers, performance has been a concern. Well, quite a big show stopper concern actually.
Just one unit test in the OfficeTemperatureFixture takes ~40 seconds to complete. Compare that to the same test using the binary file persistence mechanism used to take ~1.5 seconds to complete all but the LongRunning tests.
Problem…how do I fix the problem?
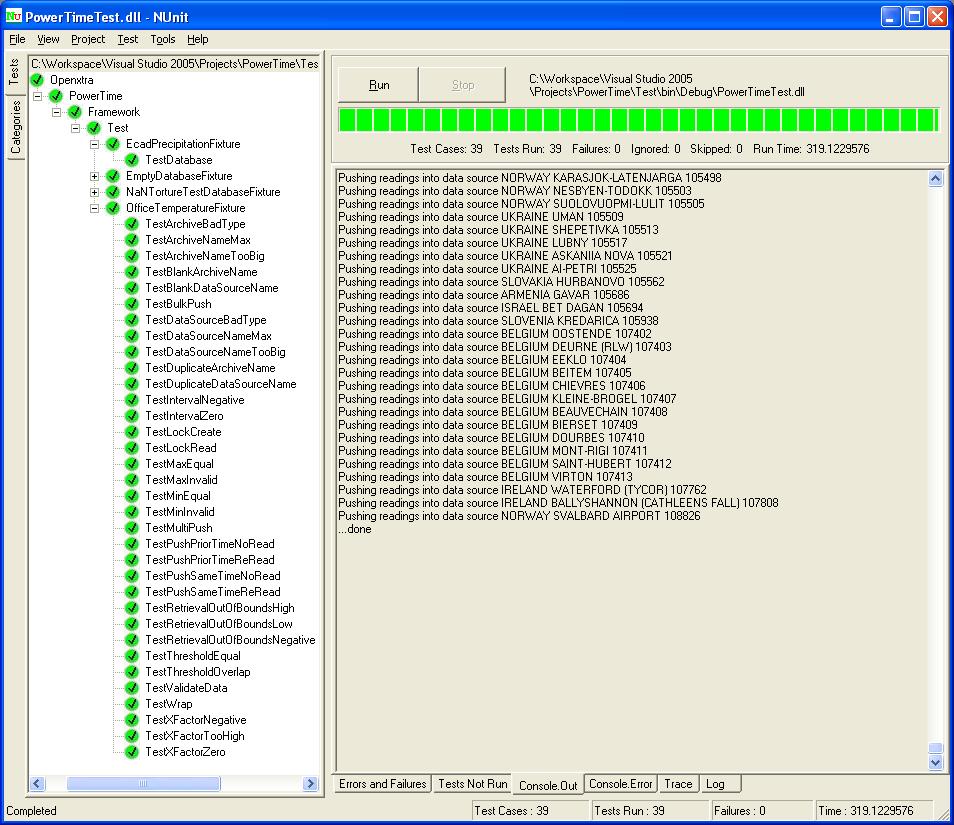
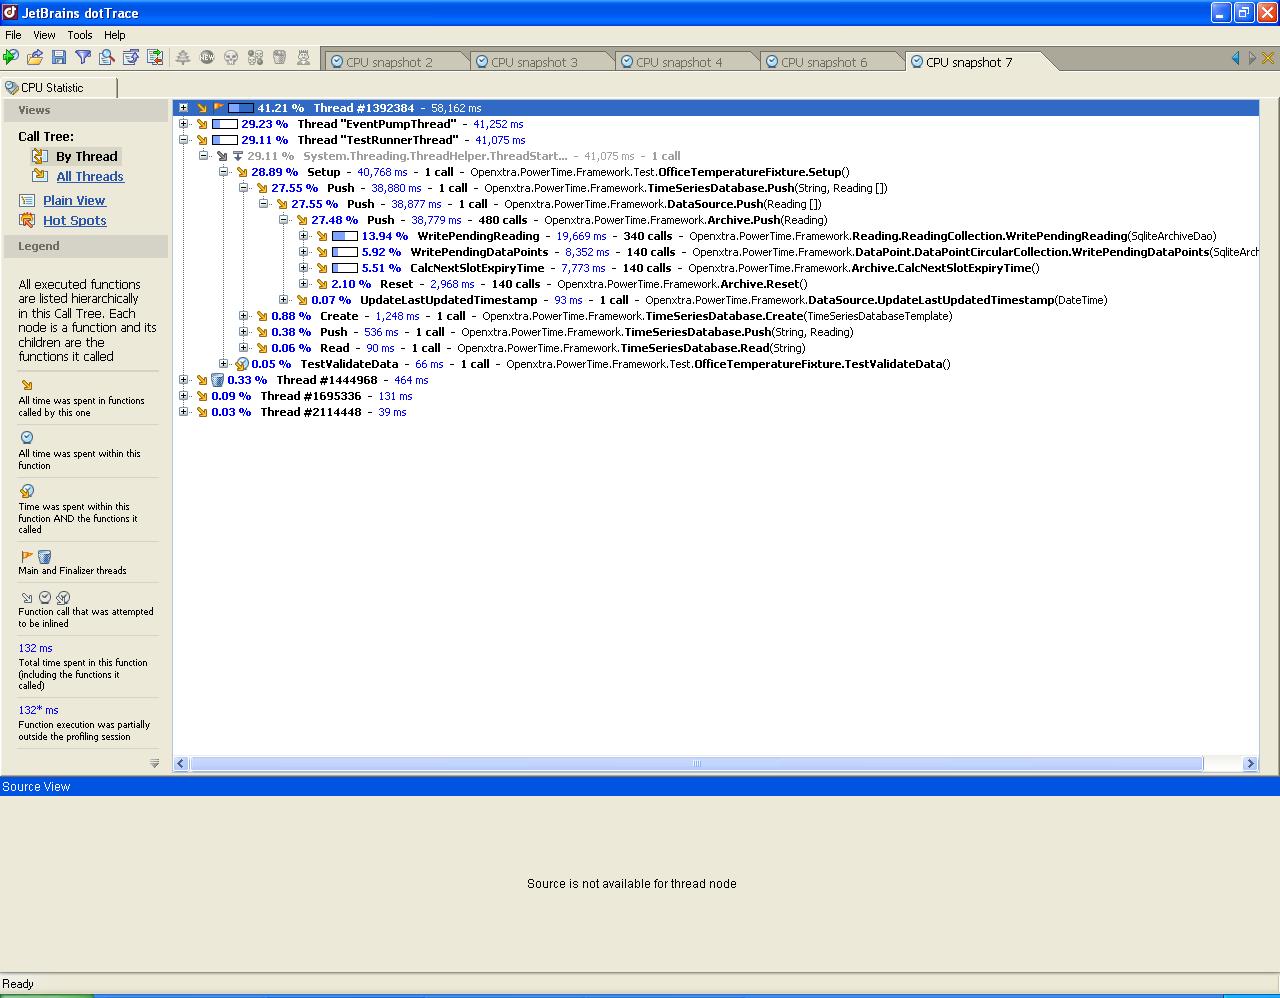
One thing I know for sure is that you don’t optimise code without a way to find out exactly where the time is being spent. Fortunately, I have a trial of JetBrains dotTrace on hand. Of the tools I’ve tried this is by far the easiest I’ve used. No special builds nothing. I just launch NUnit from dotTrace with a debug version of the PowerTime test DLL auto-loading and it just works.
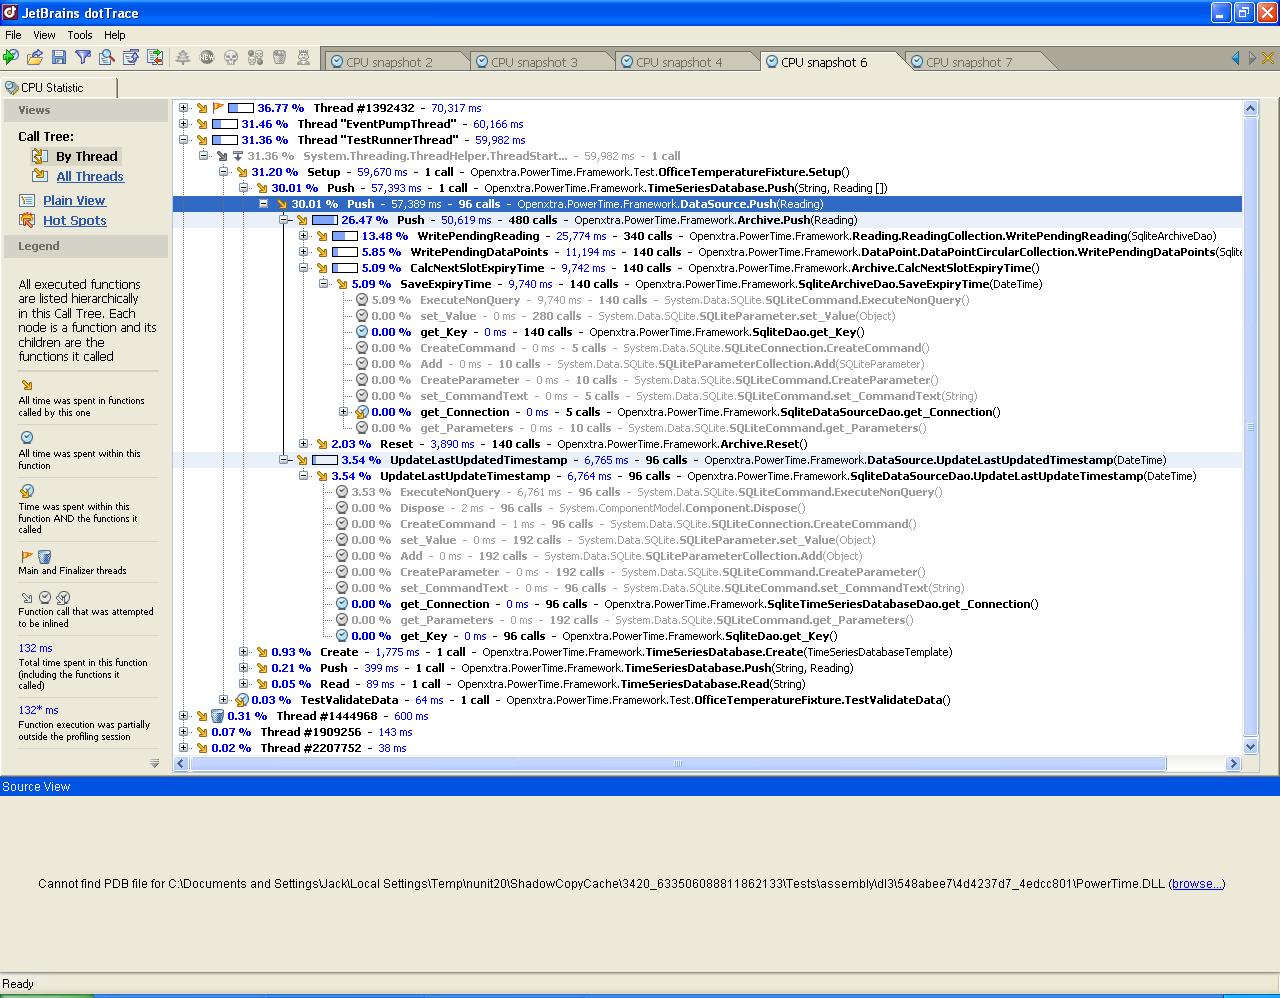
The two images of dotTrace show a run of PowerTime prior to an optimisation and the next a version that had an optimisation done. That one optimisation saved ~12 seconds. 😄
So, if you’ve got a performance problem, before you sit down and try to figure out where the runtime is being spent, go get yourself a performance tool like dotTrace and find out where your code is really spending its time. You may get some surprises and save yourself a bunch of time optimising code that isn’t consuming much runtime.