Things I Wished I'd Known Before Developing Xsensior Live
One of the best features of Xsensior Lite is the ability to view your sensor data and alerts anywhere you have web access. The website that provides the ability to see your sensor data is called Xsensior Live. Just log-in and your sensor data is displayed in pretty graphs with 24 hour highs / lows as well as any alerts that have been triggered. The feature was launched just over two years ago.
I thought I’d share some of the things I’ve learnt developing Xsensior Live, as well as maintaining and running it since launch. Building and running a real-time Internet of Things cloud does pose a number of challenges that aren’t present when developing sites that are more human interaction driven.
The System
The system consists of two parts. The first part is the website. The website provides the user interface for viewing sensor data, configuring alarm conditions and generating reports as well as a RESTful API for receiving sensor data.
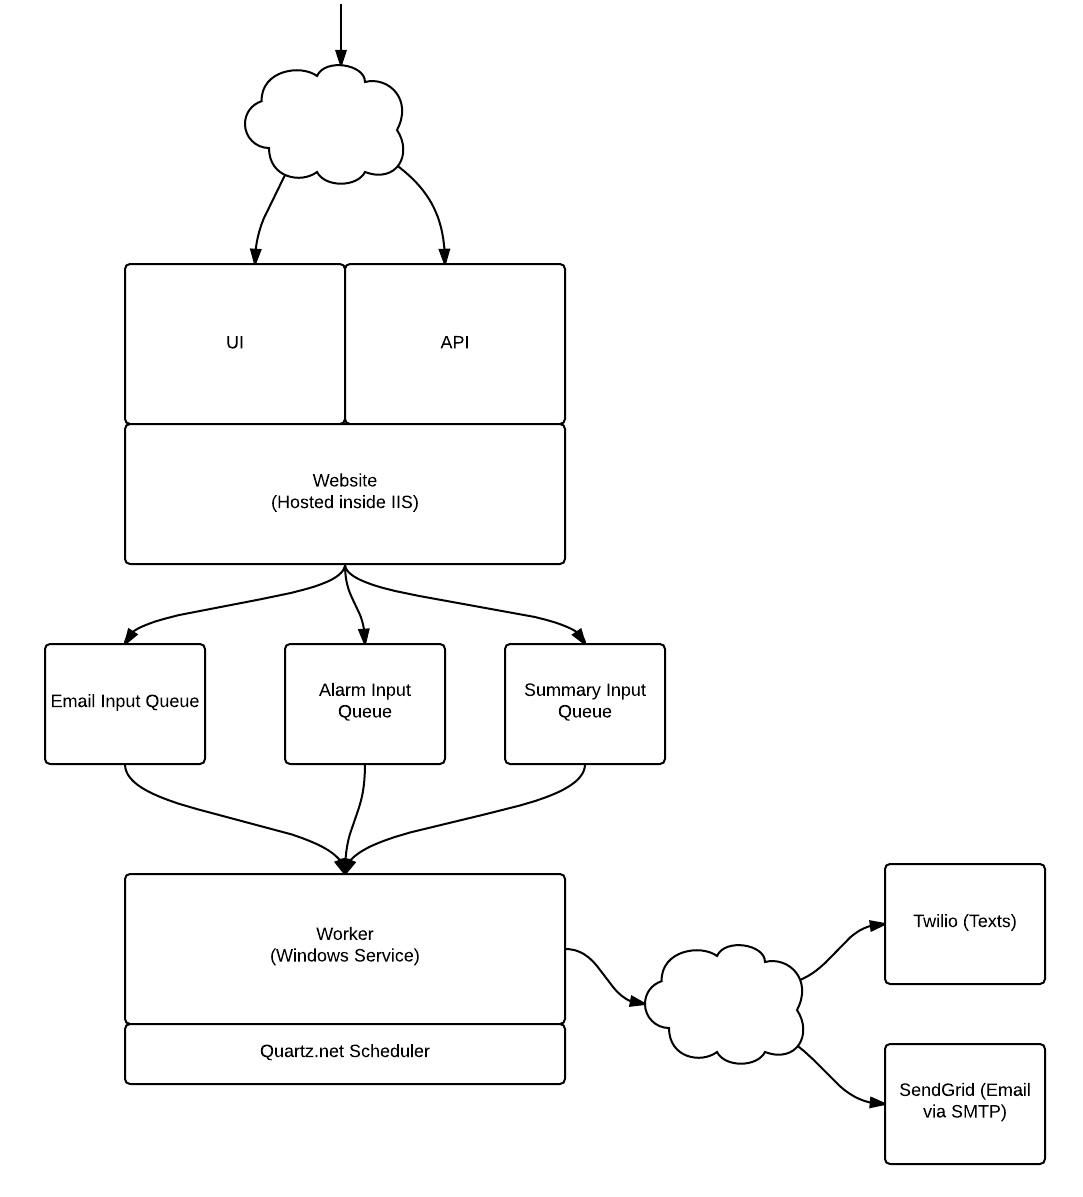
Diagram showing the architecture of the Xsensior Live system.
A worker service sits in the background waiting for messages to appear on the three MSMQ queues. The queues are an alarm input queue, email input queue and summary input queue. The alarm input queue receives messages from the API alerting the worker to new sensor input. The worker then checks the new sensor input to see if the sensor has entered an alarm state and fires off alerts as appropriate. The email input queue receives emails message from the UI, when for instance, a registration email is required. The summary input queue receives messages when the schedule configuration of the daily summary has changed. The worker then changes the schedule of the daily summary job as appropriate.
The worker service manages long running jobs by using an in-process version of the Quartz.net library. Tasks that require intermittent work, like the daily summaries or the alerts are scheduled as Quartz jobs. When the user modifies the timing for things like the daily summary schedule, or the frequency of alert repetitions, then the worker can adjust the job frequency as appropriate.
All pretty standard stuff.
But, real time data processing does present a number of challenges to any implementer of a cloud IoT service. Here are a few things I wish I’d known before hand.
Client / Server Communication
Put a lot of effort into the software connecting to your cloud service. You will save yourself a lot of pain if the client is able to handle down time on the cloud side without losing data.
Getting outside of the customer’s firewall can be quite an effort. The more enterprise your customer, the more support effort it will be. Expect an enhanced support effort even when using well supported protocols like HTTPS. If you are using something more exotic, expect an even bigger effort, especially if a new port has to be opened in the corporate firewall. That’s gonna be painful and the customer will blame you.
Make sure your customer can test the connection from the client to the server easily and provide great diagnostic information upon failure.
If your client is memory limited, then you probably won’t have any choice but to make the client not cache sensor readings. In which case, it is imperative that the system minimises downtime of the API part of your system.
Data
There will be a lot of data and it will accumulate really fast. It will rapidly get to a size that makes the database hard to handle.
Try to put a limit on the age of the data so that the quantity of data per customer is going to be limited.
Monitoring
Monitoring a website is simple enough, monitoring a Windows service is not quite so straight forward. A website has a public end point that can easily be tested using an online service like Pingdom. A Windows Service, by contrast, has no public endpoint and cannot be monitored quite so easily. You can install a probe onto your system for your favourite network monitor, or enable the Windows SNMP agent or the WMI agent. But, they are a lot more effort and open yet another port to be exploited. You’ll also need to set up your own monitor. All said, a lot more work.
If you must have a separate worker then hosting with Azure websites may provide a relatively simple answer by using the WebJobs feature. You can have one or more WebJobs and the Azure system ensures they run when necessary. A failure of a WebJob is also handled by Azure. So, if one of your long running WebJobs fails, Azure will fire it straight back up without any effort from you. Another possible route might be to avoid having a separate worker process at all. The Hangfire project looks like a very easy way to add long running background jobs to an ASP.NET project without requiring a separate worker process.
I wish I’d known about Hangfire a couple of years ago 😄
Logging
Log everything important.
Once you’ve put the effort into creating meaningful logs, you need to monitor them, and not just on your live system. If you are deploying to a development or stage environment and performing testing on there, then monitor those logs too; any errors / warnings found in your logs, should be logged and made available through a dashboard.
There are lots of tools like loggly for real time log analysis. loggly includes a nice dashboard and alarming module to alert you to various error conditions. A number of libraries exist as add-ons for well known logging libraries like log4net. You can implement loggly with just a small change to your website configuration and zero code changes.
Testing
Unit testing is great but don’t forget the integration tests. There are bugs that will fall between the cracks of a unit test, test the system as a whole too. You don’t need to test everything with integration tests, just the parts of the system likely to fail when talking to external components that are usually stubbed out of your unit tests, like the database, email server and SMS sender.
Deployment
Automate deployment of the whole system. You need to be able deploy new versions at the push of a single button. Tools are available to make automated deployment quite simple and straight forward. We’ve used Octopus Deploy for the last two years and find it invaluable. It is free for small deployments too, so no excuses. Other stacks like Ruby, Node and Java all have rich ecosystems of tools for automated deployment too.
Architect the site so that the machine to machine part is separate from the user interface part of the site. The chances are that the machine to machine part will not change very much, whereas the user interface will change much more frequently.
You need to be able to upgrade the user interface part without taking down the machine to machine part.
Conclusion
If there was a single recommendation I would suggest you take away from this article, I’d say it would be to split the API from the user interface. I think that on its own would have made the biggest impact upon managing the site over the last two years.
Next would be the client side. The more resilient you can make the client, the easier upgrading the server is going to be. The last thing you want is for your customers to lose data.
Third would be to make sure your site is returning a pucka error HTTP status code. There is no point in displaying some kind of error message and then returning a 2XX status code. Your monitor in all probability is just looking for a status code in the 2XX range and that’s it. If you fail, then you must return an appropriate error code, something in the 5XX range. There is absolutely no point in having monitoring that does not pick up errors. Obvious I know, but it does happen. Writing a test for each controller to get one of your stubs to throw and then ensure a 5XX status code does not take very long.
Update 10 March 2015: Adds the status code should be in the 5XX range section in the conclusion.